
Netflix Movies and Shows
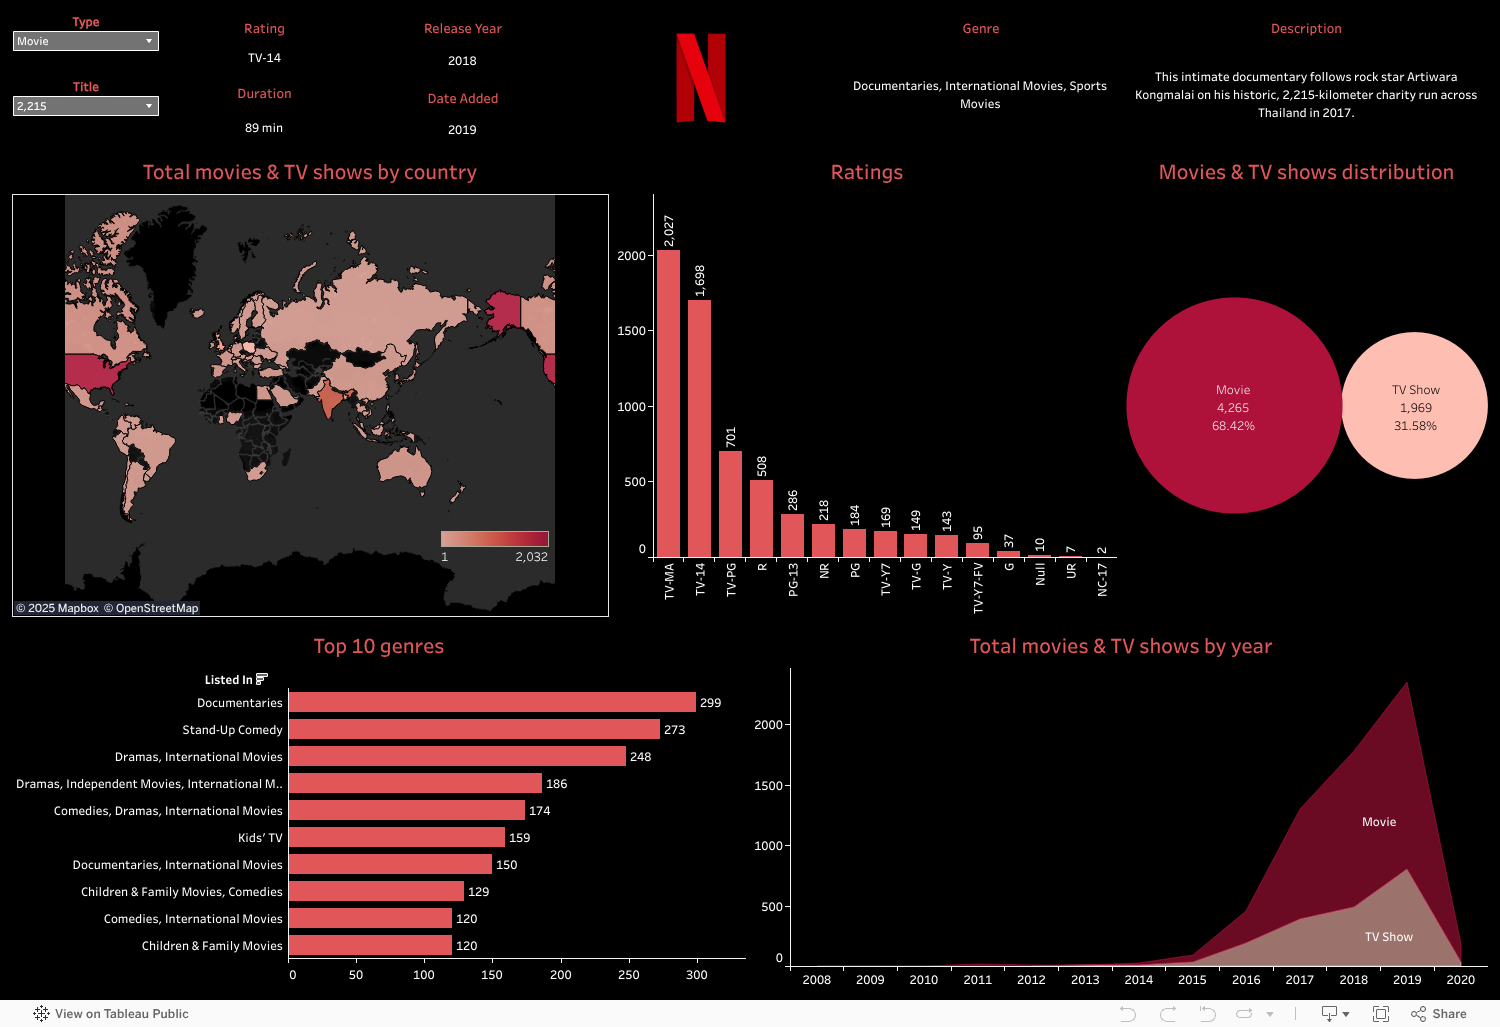
Welcome to my interactive Tableau dashboard, where we take a fun look at movie and TV show data that existed on Netflix in the decade of the 2010s. As a huge movie and TV show enthusiast, I built this to explore some intriguing trends.
Below, you can:
Toggle between Movies and TV Shows to see specific statistics for each.
Discover Top Genres to understand what was popular during this period.
Visualize Content Distribution across different countries.
...and much more!
Click around, filter the data, see if you can find your favorite movie or tv show! Simiply enjoy uncovering some cool insights about Netflix's content landscape.
If you’re on a mobile device, click here to explore the dashboard!
Technologies used
Tableau
Excel